
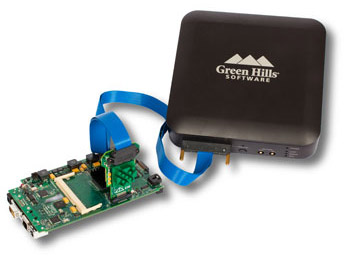
SuperTrace Probe
With its exceptionally large storage capability, the SuperTrace Probe can collect billions of trace frames, radically extending the capture window to help you find more bugs faster and easier than ever.
Technology Overview
Green Hills Software's SuperTrace Probe v3 can capture up to 4 GB of trace data at clock speeds up to 1.2 GHz (trace port speeds over 300 MHz). These capabilities combine with the TimeMachine Debugging Suite of trace analysis tools to enable you to:
- Fix bugs faster
- Optimize with ease
- Test with confidence
With its exceptionally large storage capability, the SuperTrace Probe can collect billions of trace frames, radically extending the capture window to help you find more bugs faster and easier than ever. Conventional trace hardware offers only a small fraction of this depth, limiting visibility to brief execution segments that have to be collected using carefully-defined triggers that are time-consuming and tedious to devise.
RTOS awareness
Coupled with the MULTI IDE,
the SuperTrace Probe provides RTOS-aware debugging of Green Hills Software's INTEGRITY RTOS.
Virtual Memory Support
As a result of the tight integration between INTEGRITY and MULTI, data collected by the SuperTrace Probe is virtual memory-aware, enabling MULTI to determine the virtual-to-physical mappings used by INTEGRITY.
The SuperTrace Probe is virtual memory-aware. Clicking on an instruction in the trace log automatically displays the MULTI debugger for the correct application, even in systems that switch between multiple threads or different address spaces.
Run-control and trace features
The SuperTrace Probe provides a full run-control solution, fast download speeds, and a flexible target interface. In addition, it offers many trace features that enable you to develop applications faster and more efficiently.
Fastest Download Speeds
With the industry's fastest download speeds'in excess of 10 MBps'the SuperTrace Probe enables faster development by minimizing the time spent waiting for downloads to complete. It also supports JTAG clocks from 2 kHz to 120 MHz, enabling you to maximize the download speed to your processor regardless of its core clock speed.
RTCK
On ARM targets, the SuperTrace Probe can use the RTCK signal for dynamically adaptive JTAG clocking. As a result, the SuperTrace Probe can automatically adjust on-the-fly to changes in the target's core clock speed, resulting in fast and stable target control even in systems with variable clock speeds.
Variable Target Voltage
The SuperTrace Probe can select between four different I/O interface voltages for connecting to a variety of targets. Supported voltage standards are 3.3V, 2.5V, 1.8V, and 1.3V.
Multicore Debugging
The SuperTrace Probe supports debugging of multiple cores in a single JTAG scan chain as well as tracing one of these cores. This means you can use the SuperTrace Probe in the most complex situations without sacrificing your trace port interface or trace buffer depth.
Accurate Time Measurements
On all supported targets, the SuperTrace Probe can mark each trace packet received from the target with a very precise timestamp. With a timestamp resolution of 7.5 ns, this capability enables you to make timing measurements more accurately than ever before.
Cycle Accurate
When provided for by trace targets, the SuperTrace Probe allows you to capture trace data in cycle accurate mode so you can determine how many cycles each instruction takes. As a result, you can analyze the effects of your cache and other memory systems. Besides providing insight into your memory system, cycle accurate mode lets you accurately determine system performance and measure the effects of optimization efforts.
Flexible Trace Clock
With its flexible trace clock interface, you can use the SuperTrace Probe to adjust for timing skew between trace data and clock lines. By using a phase locked loop (PLL) to adjust for this skew, the SuperTrace Probe enables trace collection from faster targets.
TimeMachine Debugging Suite
 The TimeMachine Suite's PathAnalyzer tool provides a graphical view of an application's call stack over time.
To get the full benefit from trace data collected with the SuperTrace Probe, Green Hills Software offers the MULTI TimeMachine Suite of analysis tools. This innovative collection of tools extends the range of Green Hills Software's popular MULTI Integrated Development Environment by providing a window into complex software interactions that can result in bugs, performance problems, and testing nightmares. The TimeMachine Suite presents this information in easy-to-understand displays that enable developers to quickly navigate through trace data and produce better code in less time.
» More on TimeMachine DebuggingSuite
Specifications
Trace Memory and Timing
- 4 GB (higher capacities available)
- 7.5 ns timestamp
Communications
- 10/100/1000Base-T Ethernet
- USB 2.0 High-Speed
Trigger In/Out
- SMB in: 50 Ohm, average 50 ns delay,
0 - 15 Volts - SMB out: 1 kOhm, average 50 ns delay,
0 - 3.3 Volts
JTAG Debug Port
- JTAG clock: 2 kHz – 120 MHz
- JTAG logic levels (Volts): 3.3, 2.5, 1.8, 1.3
Size and Weight
- Width: 7.5 inches
- Depth: 7.25 inches
- Height: 2.5 inches
- 3.75 pounds
Environmental
- 0-50° C
- up to 85% non-condensing humidity
Compliance
- FCC Class A
- EN 61326-1:2006
- RoHS-compliant
Made in USA
